How to analyze survey data in Excel?
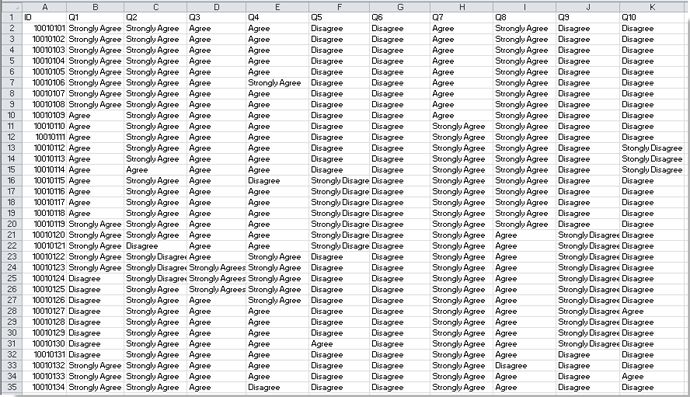
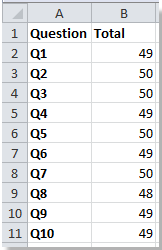
When you have collected survey responses in an Excel worksheet, such as the example shown below, you often need not only to tally responses, but also to interpret the results efficiently and present clear summaries. Survey data can include various types of questions and feedback options, making manual analysis tedious and prone to errors, especially as survey sizes grow. Excel provides a range of powerful tools to streamline the entire survey analysis process, from basic counting to generating detailed summary reports and visual presentations.
Understanding how to efficiently analyze survey data in Excel allows you to extract insights, identify trends, and effectively communicate your findings—whether for organizational feedback, marketing research, or educational needs. This guide will walk you through the practical steps for survey analysis and reporting in Excel.
Analyze a survey data in Excel
Part 1: Count all kinds of feedbacks in the survey
Part 2: Calculate the percentages of all feedbacks
Part 3: Generate a survey report with calculated results above
Part 4: Visualize survey results using Chart Tools
Part 1: Count all kinds of feedbacks in the survey
The first step is to count the total number of responses for each question in your survey. Accurately counting these responses helps in understanding participation rates and ensures that subsequent percentage calculations are valid.
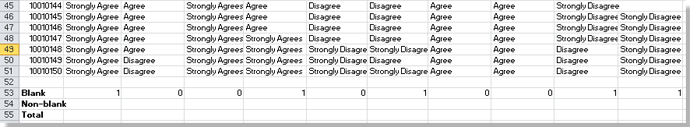
1. Select a blank cell where you want the count to appear (for example, cell B53). Enter the following formula to count blank cells (which may represent missing responses depending on your data):
=COUNTBLANK(B2:B51)Here, B2:B51 defines the data range for question 1, but you should adjust this range to match your data layout if necessary. Press Enter to confirm. Use the fill handle to drag this formula across the relevant columns (e.g., B53:K53) for other questions.
2. In the next row (e.g., cell B54), enter this formula to count non-blank responses, which gives you the number of actual feedback entries for each question:
=COUNTA(B2:B51)After entering the formula, press Enter. Drag the fill handle to autofill across the columns. This step confirms how many responses were recorded for each question.
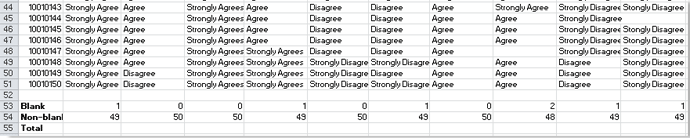
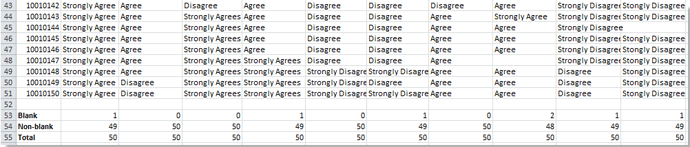
3. To obtain the total of blanks and filled cells (which is typically the same as the total number of surveyed individuals), enter this formula in cell B55:
=SUM(B53:B54)Press Enter and then autofill across columns as needed. This double-checks your data integrity and helps identify if there are any discrepancies.
You now need to count the occurrences of each feedback option, such as "Strongly Agree", "Agree", "Disagree", and "Strongly Disagree" for every question.
4. In cell B57, enter the following formula to count the number of responses that match a specific criterion (e.g., a particular feedback option defined in $B$51):
=COUNTIF(B2:B51,$B$51)Then drag the formula cell across the needed columns (B57:K57). Adjust the range and criteria reference cells to match your layout as required.
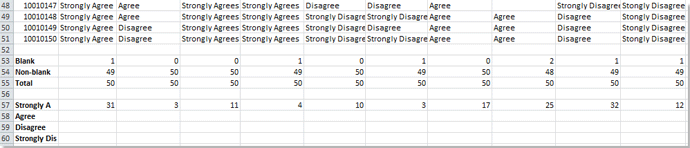
5. Similarly, to count a different response option (for example, criteria stored in $B$11), use:
=COUNTIF(B2:B51,$B$11)Enter this in cell B58, then drag the fill handle to apply across columns as needed. Be sure to update the criteria cell reference when counting different options.
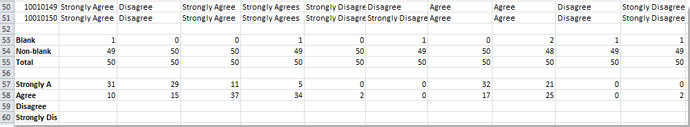
6. Repeat the above steps for each feedback type you wish to count on every question. Keeping your criteria cell references clear helps prevent formula errors and ensures consistency throughout your analysis.
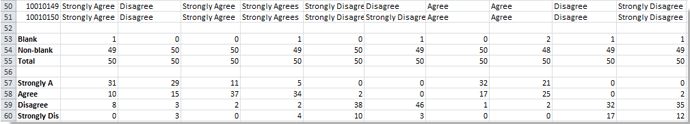
7. For total feedback per question, sum the counts of each feedback type. Enter this formula in cell B61:
=SUM(B57:B60)Press Enter, and use the fill handle to autofill as required. This ensures the number of counted responses aligns with your initial counts—if not, double-check the response categories for errors or missing labels.

Tips: If you receive unexpected results in your count formulas, ensure that response values in the raw data match the criteria exactly (including capitalization and extra spaces). Consider using the TRIM function within formulas if you suspect leading or trailing spaces in responses.
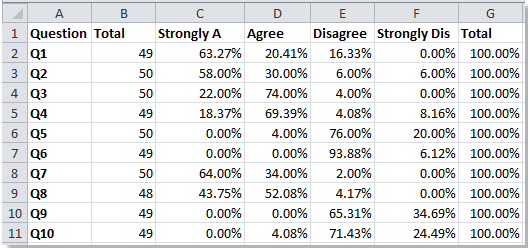
Part 2: Calculate the percentages of all feedbacks
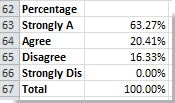
After counting, calculate the percentage that each feedback represents for its question. This step is crucial for comparing the relative weight of responses and identifying trends or majorities.
8. Select a blank cell for the percentage calculation (e.g., B62), and enter the following formula:
=B57/B$61Here, B57 is the count of a specific response, and B$61 is the total number of feedbacks for that question. Adjust references for your setup. Press Enter to confirm. Drag the fill handle of this formula cell down to get the percentages of other feedbacks. To convert the result to a percentage format, select the range, right-click, choose Format Cells, and select Percentage; or, simply use the % (Percent Style) button on the Home tab's Number group.
You can also visually emphasize the distribution of feedback by applying conditional formatting, such as color scales, to the calculated percentage values. This helps in quickly spotting trends or outliers in your survey data.
9. Keep the previous formula cells selected, then drag the Fill Handle to the right to calculate the percentages of different feedback categories in the remaining columns. Ensure that all percentages within a question add add up to 100%. Monitoring this can serve as a check for potential errors in response categorization or formula references.

Note: If the calculated percentages do not sum to 1 (or 100%), verify that the sum of the counted responses matches the total feedback count. Also, ensure there are no duplicated or misclassified responses in your raw data.
Part 3: Generate a survey report with calculated results above
Once calculations are in place, you are ready to create a survey result report. This step typically involves reorganizing and presenting data in a clear, concise manner, often on a separate worksheet or summary area.
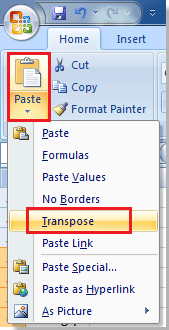
10. Select the column headers in your survey data (e.g., A1:K1 in this example), right-click and choose Copy. On a blank worksheet, right-click on the desired paste location and choose Transpose (T). This will paste the headers vertically, which can make further summary tables easier to read and manipulate.
For users of Microsoft Excel 2007, the Transpose function is accessible via the Home > Paste > Transpose commands after copying. This step reorients your header labels, facilitating more flexible report layouts.
11. Adjust and edit the pasted titles as needed—for instance, you may want to rename them for clarity or to suit your report's intended audience.
 |  |
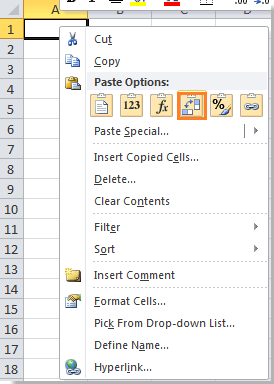
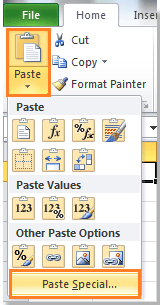
12. Select the results you wish to highlight in your summary report. Copy this data, switch to your target worksheet, and select a blank cell (e.g., B2). Then, under the Home tab, click Paste > Paste Special. This allows you to use advanced paste options tailored for report creation.
13. In the Paste Special dialog box, ensure both Values and Transpose are checked in their respective sections, then click OK to finalize the paste. This step helps consolidate your processed results into a clearly formatted report view.
 |
 |
Continue to copy and paste additional processed data as necessary—whether counts, percentages, or cross-question summaries. Repeat these actions to build out a complete, customized survey report that is well-structured for sharing or further analysis.
Tips: When preparing survey reports, double-check that your pasted data matches the processed results, especially after transposing or reordering information. Saving your work in separate stages or using Undo can help avoid accidental data overwrites.
Part 4: Visualize survey results using Chart Tools
Transforming survey summaries into visual charts can make patterns and contrasts in your data more accessible, especially for presentations or reports. Excel's built-in chart tools enable you to create a wide variety of visualizations from your processed counts or percentages, helping communicate results clearly to stakeholders who may prefer graphical over tabular data.
1. Select the summary data you wish to visualize—this could be a summary table of counts, percentages, or a single question's spread of responses.
2. Go to the Insert tab and choose from chart types such as Bar Chart, Column Chart, Pie Chart, or Doughnut Chart. Bar and column charts are suitable for comparisons across categories, while pie charts help show proportional breakdowns.
3. After inserting a chart, use the Chart Tools derived tabs (Design, Format) to customize the chart's appearance, layout, and labels for clarity.
To ensure that your charts remain clear and meaningful, make sure your data is well-structured (no missing labels) and that you choose chart types that best fit your summary format. For charts showing percentages, check that your dataset sums to 100% for that category.
Tips: Double-click any chart element (e.g., axis labels, legends) for detailed formatting options. Use Chart Styles or add Data Labels to enhance interpretability.
If your chart does not reflect the correct data or appears blank, double-check the source data selection and ensure no additional hidden rows or columns are included.
Pros: Visual charts help highlight trends, compare distributions, and present your findings effectively, but be mindful to avoid overloading charts with too many categories, which can reduce clarity.
Best Office Productivity Tools
Supercharge Your Excel Skills with Kutools for Excel, and Experience Efficiency Like Never Before. Kutools for Excel Offers Over 300 Advanced Features to Boost Productivity and Save Time. Click Here to Get The Feature You Need The Most...
Office Tab Brings Tabbed interface to Office, and Make Your Work Much Easier
- Enable tabbed editing and reading in Word, Excel, PowerPoint, Publisher, Access, Visio and Project.
- Open and create multiple documents in new tabs of the same window, rather than in new windows.
- Increases your productivity by 50%, and reduces hundreds of mouse clicks for you every day!
All Kutools add-ins. One installer
Kutools for Office suite bundles add-ins for Excel, Word, Outlook & PowerPoint plus Office Tab Pro, which is ideal for teams working across Office apps.
- All-in-one suite — Excel, Word, Outlook & PowerPoint add-ins + Office Tab Pro
- One installer, one license — set up in minutes (MSI-ready)
- Works better together — streamlined productivity across Office apps
- 30-day full-featured trial — no registration, no credit card
- Best value — save vs buying individual add-in