How to calculate weighted average in Excel?
Weighted averages are commonly used in scenarios where different items contribute unequally to the overall result. For instance, when analyzing a shopping list that includes product prices, weights, and quantities, using the regular AVERAGE function in Excel would only compute the simple arithmetic mean, ignoring how often or how heavily items appear. However, in many business or budgeting cases, you may need to calculate a weighted average—such as the average price per unit, considering quantities or weights—so that each item’s impact is proportional to its significance. This article will cover how to calculate weighted averages in Excel, including situations with specific criteria, as well as further techniques using VBA and Pivot Tables for more dynamic or complex requirements.
Calculate weighted average in Excel
Calculate weighted average if meeting given criteria in Excel
VBA code – Automate weighted average calculation for dynamic ranges or multiple criteria
Calculate weighted average in Excel
Suppose you have a shopping list as shown in the screenshot below. While Excel’s AVERAGE function would give you the mean price without accounting for weight or quantity, a more accurate approach in these cases is to calculate the weighted average. This better reflects the real cost per unit by giving items with higher weights or frequencies a stronger influence on the final result.

To compute the weighted average price, use a combination of the SUMPRODUCT and SUM functions as follows:
Select a blank cell, such as F2, enter the following formula:
=SUMPRODUCT(C2:C18,D2:D18)/SUM(C2:C18)and press the Enter key to get the result.
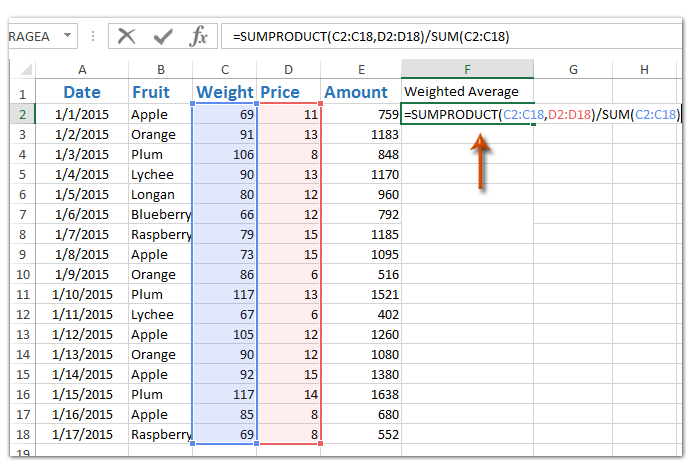
Note: In this formula, C2:C18 refers to the Weight column, and D2:D18 refers to the Price column. Adjust these ranges as needed for your own data layout. The SUMPRODUCT function multiplies each weight by the corresponding price and sums the results, while SUM totals the weights—yielding the correct weighted average. Be sure to use ranges of equal length and ensure there are no mismatched or empty cells in your data, as this could lead to calculation errors.
If the calculated weighted average displays too many or too few decimal places for your preference, select the cell, then click the Increase Decimal button ![]() or Decrease Decimal button
or Decrease Decimal button ![]() on the Home tab to adjust the displayed decimal places as needed.
on the Home tab to adjust the displayed decimal places as needed.

If you encounter an error such as #VALUE!, double-check that each referenced cell contains a numeric value and that the ranges are consistent. Also, avoid including any header row in your calculation range to ensure accurate results. When working with larger datasets, consider using named ranges for clarity and ease of maintenance.
Calculate weighted average if meeting given criteria in Excel
The previous formula calculates the weighted average price for all items. In practical analysis, you might instead want the weighted average for specific categories, such as finding the weighted average price just for Apples. In such cases, you can enhance the formula to include a condition based on your criteria.
To do this, select a blank cell, such as F8, and enter the following formula:
=SUMPRODUCT((B2:B18="Apple")*C2:C18*D2:D18)/SUMIF(B2:B18,"Apple",C2:C18)Then press the Enter key to calculate the weighted average meeting your specific criteria. This formula multiplies each weight and price pair only if the item matches the condition (“Apple” in this case), sums them, and divides by the sum of weights for that item only.

Note: Here, B2:B18 is the Fruit column, C2:C18 is the Weight, and D2:D18 is the Price. Replace “Apple” with another item as needed. This method works well for filtering by one condition; if you need to filter by multiple criteria (e.g., fruit type and supplier), a helper column or more advanced formula may be necessary.
After applying the formula, you might want to adjust decimals for clarity. Select the result cell and use the Increase Decimal ![]() or Decrease Decimal
or Decrease Decimal ![]() buttons on the Home tab to change the decimal places shown.
buttons on the Home tab to change the decimal places shown.
Should the formula return an unexpected result, confirm that the criteria has matches within your target range, and watch for any blank cells or text entries in columns intended to be numeric.
VBA Code – Automate the calculation of weighted average for dynamic data ranges or multiple criteria
In some situations, you may frequently need to compute weighted averages over ranges that change in size, contain missing values, or require flexible filtering, such as applying multiple criteria at once. Instead of manually updating formulas or ranges, automating the calculation with a VBA macro can save you time and reduce the chances of errors—especially useful when dealing with large or regularly updated datasets.
Here’s how to create and use a VBA macro for weighted averages:
1. Click Developer > Visual Basic (or press Alt + F11) to open the Microsoft Visual Basic for Applications editor window. Next, click Insert > Module, then paste the following code below into the new module window:
Sub WeightedAverageVBA()
    Dim rngCriteria As Range
    Dim rngWeight As Range
    Dim rngValue As Range
    Dim criteriaStr As String
    Dim totalWeighted As Double
    Dim totalWeight As Double
    Dim i As Long

    On Error Resume Next
    xTitleId = "KutoolsforExcel"

    Set rngCriteria = Application.InputBox("Select the range for criteria (optional, press Cancel to skip):", xTitleId, Type:=8)
    criteriaStr = Application.InputBox("Enter criteria for filtering (leave blank for all):", xTitleId, Type:=2)
    Set rngWeight = Application.InputBox("Select the Weight (numeric) range:", xTitleId, Type:=8)
    Set rngValue = Application.InputBox("Select the Value (e.g. Price) range:", xTitleId, Type:=8)

    totalWeighted = 0
    totalWeight = 0

    If rngCriteria Is Nothing Or criteriaStr = "" Then
        For i = 1 To rngWeight.Cells.Count
            If IsNumeric(rngWeight.Cells(i).Value) And IsNumeric(rngValue.Cells(i).Value) Then
                totalWeighted = totalWeighted + rngWeight.Cells(i).Value * rngValue.Cells(i).Value
                totalWeight = totalWeight + rngWeight.Cells(i).Value
            End If
        Next i
    Else
        For i = 1 To rngWeight.Cells.Count
            If rngCriteria.Cells(i).Value = criteriaStr Then
                If IsNumeric(rngWeight.Cells(i).Value) And IsNumeric(rngValue.Cells(i).Value) Then
                    totalWeighted = totalWeighted + rngWeight.Cells(i).Value * rngValue.Cells(i).Value
                    totalWeight = totalWeight + rngWeight.Cells(i).Value
                End If
            End If
        Next i
    End If

    If totalWeight = 0 Then
        MsgBox "Weighted average cannot be calculated: total weight is zero.", vbExclamation, xTitleId
    Else
        MsgBox "Weighted average: " & totalWeighted / totalWeight, vbInformation, xTitleId
    End If
End Sub2. Press F5 (or click the ![]() Run button) to execute.
Run button) to execute.
You will be prompted to select the ranges step by step (criteria range—this can be skipped if not needed, weight range, and value range). You can also enter specific criteria to filter your calculation or leave it blank to consider all data. The macro supports dynamic data ranges, making it practical if your table grows or changes regularly.
Finally you will get a message box listing the weighted average result.
Tips:
- This approach automates repetitive weighted average analysis and can be further expanded to handle additional filtering or output options.
- Ensure the selected ranges are of equal length, and that data types are consistent.
- Include basic error handling as shown (e.g., in cases where no valid weights are found or the weight sum is zero).
- If you want to apply to filtered/visible rows only, you can further enhance the code with special cell enumeration.
If you encounter permission or macro security issues, make sure macros are enabled in your Excel settings before running the code.
Related articles:
Average range with rounding in Excel
Average rate of change in Excel
Best Office Productivity Tools
Supercharge Your Excel Skills with Kutools for Excel, and Experience Efficiency Like Never Before. Kutools for Excel Offers Over 300 Advanced Features to Boost Productivity and Save Time. Click Here to Get The Feature You Need The Most...
Office Tab Brings Tabbed interface to Office, and Make Your Work Much Easier
- Enable tabbed editing and reading in Word, Excel, PowerPoint, Publisher, Access, Visio and Project.
- Open and create multiple documents in new tabs of the same window, rather than in new windows.
- Increases your productivity by 50%, and reduces hundreds of mouse clicks for you every day!
All Kutools add-ins. One installer
Kutools for Office suite bundles add-ins for Excel, Word, Outlook & PowerPoint plus Office Tab Pro, which is ideal for teams working across Office apps.
- All-in-one suite — Excel, Word, Outlook & PowerPoint add-ins + Office Tab Pro
- One installer, one license — set up in minutes (MSI-ready)
- Works better together — streamlined productivity across Office apps
- 30-day full-featured trial — no registration, no credit card
- Best value — save vs buying individual add-in