How to show only duplicate rows in Excel column?
In various data analysis scenarios, you might encounter a situation where a column contains both unique and duplicate values, but you only want to view or process the duplicate rows. Manually searching for and hiding each unique value one by one can be inefficient and error-prone, especially with large datasets. An example is illustrated in the screenshot below, where only duplicate entries remain visible after filtering.
To efficiently tackle this challenge, Excel provides several approaches ranging from built-in features to advanced add-ins and automation solutions. These methods significantly reduce manual workload, help avoid mistakes, and are applicable regardless of dataset size. Below, various practical solutions are outlined, allowing you to select the most suitable option based on your needs and Excel proficiency.
Show only duplicates with Conditional Formatting and Filter functions
Show only duplicates with Kutools for Excel ![]()
Show only duplicates with formulas and Filter functions
Show only duplicates with VBA code (Auto Filter & Display Only Duplicates)
Show only duplicates with Conditional Formatting and Filter functions
This method leverages Excel's Conditional Formatting to visually highlight duplicate values within the selected column. Once highlighted, the Filter feature can be used to display only those duplicates, keeping your unique data out of view. This approach is especially suitable for users who prefer an intuitive, mouse-driven solution and wish to avoid writing formulas or code.
Benefits of this method include simplicity and direct visual feedback. However, it is best suited for moderate-size datasets. For frequent or large-scale operations, or automation needs, see other solutions below.
1. Select the values you want to examine for duplicates, then click Home > Conditional Formatting > Highlight Cells Rules > Duplicate Values. In the Duplicate Values dialog, select Duplicate from the left drop-down list, choose a desired highlight format from the right drop-down, and click OK. See screenshot:
Duplicates will be highlighted in your chosen color.
2. Click the column header (for example, "Name"), then go to Data > Filter to activate the Filter feature.
3. Click the Filter icon in the column header. From the menu, choose Filter by Color, then pick the color you set for duplicates in the earlier step. See screenshot:
4. Click OK. As a result, only rows containing duplicate values will remain visible, with unique values hidden from the filtered list.
This method is recommended for quick analyses and one-time reviews; remember, if you change the data after applying the conditional formatting, re-apply the filter to update the results accordingly.
Show only duplicates with Kutools for Excel
For users who regularly need to manage or analyze duplicate and unique rows, Kutools for Excel provides a convenient and easy-to-use utility called Select Duplicate & Unique Cells. This feature allows you to quickly identify and select unique rows, so you can hide them in just a few clicks, leaving only duplicate values visible. Kutools for Excel is particularly valuable for large, complex data sets where manual operations may be cumbersome or time-consuming.
After free installing Kutools for Excel, take these steps:
1. Select your data range, then click Kutools > Select > Select Duplicate & Unique Cells.
2. In the Select Duplicate & Unique Cells dialog, check Unique values only and Select entire rows. Click OK. A summary dialog appears, displaying the number of rows selected.
3. Click OK to close the summary dialog. The unique rows are now selected. Right-click any row header of the selected group, then choose Hide from the context menu.
With these steps, all unique rows are hidden, presenting only your duplicate rows for analysis or further action.
This approach is particularly advantageous for repetitive workflows, data review sessions, or when collaborating on large data tables, as it improves speed and reduces the chance of accidental data omission.
Show only duplicates with formulas and Filter functions
If you prefer a method based entirely on Excel's native capabilities and want precise, flexible control, using formulas in combination with the Filter function can be very effective. By setting up a formula to tag duplicate rows, you can then filter only those rows for viewing and further operation.
This approach is ideal for users who are comfortable working with formulas and want the ability to customize or extend logic, such as identifying duplicates across multiple columns or applying conditional duplicates checks. On the other hand, setting up formulas for large or dynamic datasets may require attention when copying formulas and keeping references consistent.
1. In a blank adjacent cell to your dataset (for example, in cell B2 if your data starts in A2), enter the following formula to flag duplicate entries:
=COUNTIFS($A$2:$A$12,$A2)>1Drag the fill handle down through the target range. A result of TRUE in the formula cell indicates a duplicate, whereas FALSE marks a unique value. See screenshot: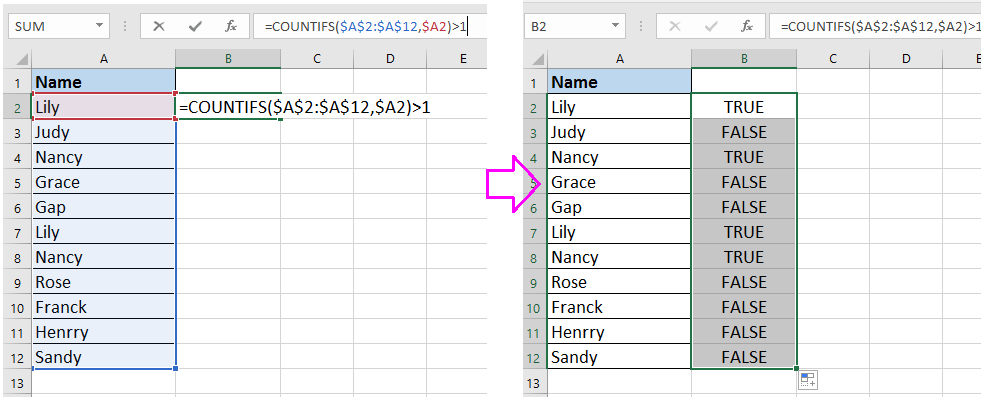
2. Click the header of your helper column (B1, directly above your formulas), then click Data > Filter to add filter controls.
3. Use the drop-down filter in the helper column to select only TRUE, then click OK. Only duplicate values will be displayed in the main data column.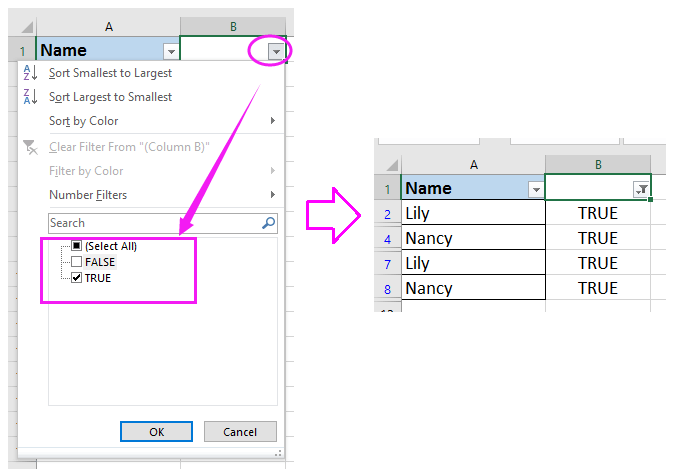
Note: Adjust A2:A12 in the formula as needed, based on your actual data range. For dynamic datasets, ensure you cover the entire potential range, or use Excel Tables for easier column management.
When adjusting or expanding your dataset, reapply the formula and filter to maintain accurate results. If you encounter mismatches, double-check the cell reference ranges to avoid partial coverage.
Show only duplicates with VBA code (Auto Filter & Display Only Duplicates)
For advanced Excel users, automating the duplicate row detection and display process can save significant time, particularly when working with large or frequently updated datasets. Using a VBA macro, you can instantly filter and view only duplicate rows in your chosen column—without manual color formatting or formula creation. This approach is suitable when you desire a one-click or repeatable solution that can be easily reapplied to varying data ranges.
Advantages of this method include speed, consistency, and suitability for very large datasets. However, you’ll need to enable macros and have at least moderate familiarity with the Excel VBA editor. If you’re new to macros, consider saving your work beforehand, as macro operation may not be undone with the usual “Undo” feature.
1. Go to Developer > Visual Basic to open the Microsoft Visual Basic for Applications window. Click Insert > Module, and paste the following code into the module:
Sub FilterDuplicatesOnly()
    Dim rng As Range
    Dim ws As Worksheet
    Dim duplicateCol As Range
    Dim lastRow As Long
    Dim colNum As Long

    On Error Resume Next
    xTitleId = "KutoolsforExcel"

    Set ws = Application.ActiveSheet
    Set rng = Application.Selection

    If rng Is Nothing Then
        MsgBox "Please select a range first.", vbExclamation
        Exit Sub
    End If

    lastRow = ws.Cells(ws.Rows.Count, rng.Cells(1, 1).Column).End(xlUp).Row
    colNum = rng.Column

    ' Add a temporary helper column next to the selected column
    ws.Cells(1, colNum + 1).Value = "IsDuplicate"
    ws.Range(ws.Cells(2, colNum + 1), ws.Cells(lastRow, colNum + 1)).Formula = "=COUNTIF(" & rng.Address & "," & ws.Cells(2, colNum).Address(False, False) & ")>1"

    ' Apply filter to show only duplicates
    ws.Range(ws.Cells(1, colNum), ws.Cells(lastRow, colNum + 1)).AutoFilter Field:=2, Criteria1:="TRUE"
End Sub
2. After entering the code, return to Excel and select the data column where you want to filter duplicates (for example, select all cells from A2 to A12 if your data is in column A). Then, in the VBA editor, click the ![]() Run button to execute the macro. The macro will insert a temporary helper column, use it to identify duplicates, then automatically filter to show only the rows with duplicate values.
Run button to execute the macro. The macro will insert a temporary helper column, use it to identify duplicates, then automatically filter to show only the rows with duplicate values.
The temporary helper column is needed for this type of VBA automation. If you wish, you can remove this column after reviewing your duplicate data.
Practical tip: If you run into any errors, ensure you have selected a data range before running the macro. You can easily re-run the macro whenever your data changes, making it especially useful for periodic duplicate checks.
This macro allows you to quickly focus on your duplicate data without the repetitive steps of manual formatting, formula creation, or filter setup.
Show Duplicate Values Only
Best Office Productivity Tools
Supercharge Your Excel Skills with Kutools for Excel, and Experience Efficiency Like Never Before. Kutools for Excel Offers Over 300 Advanced Features to Boost Productivity and Save Time. Click Here to Get The Feature You Need The Most...
Office Tab Brings Tabbed interface to Office, and Make Your Work Much Easier
- Enable tabbed editing and reading in Word, Excel, PowerPoint, Publisher, Access, Visio and Project.
- Open and create multiple documents in new tabs of the same window, rather than in new windows.
- Increases your productivity by 50%, and reduces hundreds of mouse clicks for you every day!
All Kutools add-ins. One installer
Kutools for Office suite bundles add-ins for Excel, Word, Outlook & PowerPoint plus Office Tab Pro, which is ideal for teams working across Office apps.
- All-in-one suite — Excel, Word, Outlook & PowerPoint add-ins + Office Tab Pro
- One installer, one license — set up in minutes (MSI-ready)
- Works better together — streamlined productivity across Office apps
- 30-day full-featured trial — no registration, no credit card
- Best value — save vs buying individual add-in