How to find max or min value in a certain date range (between two dates) in Excel?
In day-to-day data analysis, especially when working with transactional records or time-series data, you may often need to identify the highest or lowest value that occurs within a specific time period. For example, imagine you have a table as shown in the screenshot below, and you want to determine the maximum or minimum value between two dates—such as from2016/7/1 to2016/12/1. This is a common requirement when generating reports on specific periods, comparing monthly performance, or tracking peaks and troughs in data. This article will guide you through several practical solutions using Excel formulas, VBA code, and built-in features, helping you to quickly and accurately extract the value you need.
➤ Find max or min value in a certain date range with array formulas
➤ VBA code: Automatically find max or min value in a specified date range
➤ Other built-in Excel methods: Use Pivot Table to filter and display max/min by date range
Find max or min value in a certain date range with array formulas
One straightforward approach is to use array formulas in Excel, which allow you to compute values based on multiple criteria—such as checking if dates fall within your specified range. This method is suitable for data of moderate size and for users comfortable entering formulas.
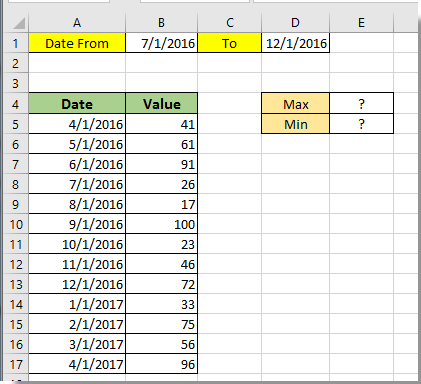
Suppose your worksheet lists dates in column A (A5:A17) and corresponding values in column B (B5:B17), with the start and end dates for the range entered in cells B1 and D1, respectively.
1. Select a blank cell where you want to display the result (e.g., E2).
Finding the max value between 2016/7/1 and 2016/12/1:
2. Enter the following formula in the selected cell. After editing, press Ctrl + Shift + Enter (not just Enter), so that Excel recognizes it as an array formula:
=MAX(IF((A5:A17<=$D$1)*(A5:A17>=$B$1),B5:B17,""))This formula checks which dates fall between your start and end dates, and only considers the values from the matching rows to calculate the maximum.

Finding the min value between 2016/7/1 and 2016/12/1:
3. To find the minimum within the same date range, use a similar approach. Enter the following formula (and again, confirm with Ctrl + Shift + Enter):
=MIN(IF((A5:A17<=$D$1)*(A5:A17>=$B$1), B5:B17, ""))This formula operates in the same way, but returns the minimum value that matches your date criteria.

Notes:
- In the examples above, A5:A17 is the range containing your dates, $B$1 is the start date, $D$1 is the end date, and B5:B17 is the range of values you wish to evaluate. Adjust these references to match your actual data.
- Ensure that the two ranges you reference are of the same length—otherwise, the formula may generate errors.
- Double-check that your date entries are formatted as dates, not as text, or the formula might not work as intended.
Tips:
- If you are working with Office 365 or Excel 2021 and later, you can use the MAXIFS and MINIFS functions for more straightforward criteria-based calculations.
- If the formula returns a 0 or blank unexpectedly, verify that your date range overlaps with the available data dates and check for any unnoticed blank cells.
VBA code: Automatically find max or min value in a specified date range
For users dealing with large datasets, needing to repeat this task often, or looking for automation in reporting, a VBA macro solution can efficiently find the max or min value within a chosen date range. With VBA, you can prompt the user to select the relevant ranges and set the dates each time, making it ideal for dynamic applications or advanced workflow integration.
1. Go to Developer > Visual Basic. In the VBA editor window that appears, click Insert > Module, and then copy and paste the following code into the new module:
Sub FindMaxMinInDateRange_Robust()
    Dim ws As Worksheet
    Dim dateRange As Range, valueRange As Range
    Dim startCell As Range, endCell As Range
    Dim startDate As Date, endDate As Date
    Dim i As Long
    Dim d As Date, v As Variant
    Dim hasHit As Boolean
    Dim maxV As Double, minV As Double
    Const TITLE As String = "KutoolsforExcel"

    On Error GoTo FailFast

    Set ws = ActiveSheet


    Set dateRange = Application.InputBox("Select the DATE range:", TITLE, Type:=8)
    If dateRange Is Nothing Then Exit Sub
    Set valueRange = Application.InputBox("Select the VALUE range (same rows as date range):", TITLE, Type:=8)
    If valueRange Is Nothing Then Exit Sub

    If dateRange.Rows.Count <> valueRange.Rows.Count Then
        MsgBox "Date range and value range must have the SAME number of rows.", vbExclamation, TITLE
        Exit Sub
    End If


    Set startCell = Application.InputBox("Select START date cell:", TITLE, Type:=8)
    If startCell Is Nothing Then Exit Sub
    Set endCell = Application.InputBox("Select END date cell:", TITLE, Type:=8)
    If endCell Is Nothing Then Exit Sub

    If Not IsDate(startCell.Value) Or Not IsDate(endCell.Value) Then
        MsgBox "Start/End cell must contain valid dates.", vbExclamation, TITLE
        Exit Sub
    End If

    startDate = CDate(startCell.Value)
    endDate = CDate(endCell.Value)

    If startDate > endDate Then
        Dim tmp As Date
        tmp = startDate: startDate = endDate: endDate = tmp
    End If


    For i = 1 To dateRange.Rows.Count
        If IsDate(dateRange.Cells(i, 1).Value) Then
            d = CDate(dateRange.Cells(i, 1).Value)
            If d >= startDate And d <= endDate Then
                v = valueRange.Cells(i, 1).Value
                If IsNumeric(v) And Not IsEmpty(v) Then
                    If Not hasHit Then
                        maxV = CDbl(v): minV = CDbl(v)
                        hasHit = True
                    Else
                        If CDbl(v) > maxV Then maxV = CDbl(v)
                        If CDbl(v) < minV Then minV = CDbl(v)
                    End If
                End If
            End If
        End If
    Next i

    If hasHit Then
        MsgBox "Max value in range: " & maxV & vbCrLf & _
               "Min value in range: " & minV, vbInformation, TITLE
    Else
        MsgBox "No rows matched the date range (or values were non-numeric).", vbExclamation, TITLE
    End If
    Exit Sub

FailFast:
    MsgBox "Something went wrong: " & Err.Description, vbExclamation, TITLE
End Sub
2. To run the macro, click the ![]() button in the VBA editor (or press F5). Follow the prompts to select the date and value ranges, and to enter the start and end dates. The resulting maximum and minimum values for your specified date interval will be displayed in a dialog box.
button in the VBA editor (or press F5). Follow the prompts to select the date and value ranges, and to enter the start and end dates. The resulting maximum and minimum values for your specified date interval will be displayed in a dialog box.
Tips:
- Ensure that the date and value ranges selected contain the same number of rows and correspond directly with each other.
- This approach is especially helpful for processing extensive lists or automating repetitive maximum/minimum calculations based on changing criteria.
- If an empty or invalid range is selected, or if the date input is not correctly formatted, the code may not yield a valid result—double-check your selections before running.
Other built-in Excel methods: Use PivotTable to filter and display max/min by date range
If you prefer not to use formulas or code, leveraging Excel’s PivotTable feature offers an interactive, formula-free method to filter data by date and display summary values like maximum or minimum. This solution is suitable for users who need to explore data, generate reports, or easily adjust criteria using a graphical interface.
1. Select your table (including both dates and values), then go to the Insert tab and click PivotTable.
2. In the Create PivotTable dialog, choose where you want the PivotTable to be placed, and click OK.
3. In the PivotTable Fields pane, drag the Date field to the Rows area, and the Values field (the one for which you want to find max/min) to the Values area. By default it will show Sum; click the field in Values, choose Value Field Settings, and change to Max or Min as needed.
4. To filter by a specific date range, click the drop-down on the row labels for the Date field, choose Date Filters > Between…, then specify your start and end dates (e.g., 2016/7/1 to 2016/12/1) and click OK.
The PivotTable will now display the maximum or minimum value for each date within your specified range. If you only need the single highest or lowest value across that range, you can further filter or visually scan the summarized result.
Notes:
- Ensure all cells in the Date column are real dates (not text). Mixed formats can cause filters to miss rows.
- If the source data changes, right-click the PivotTable and choose Refresh to update results.
- Depending on your layout, Excel may group dates by month/quarter/year. If needed, right-click a date in the PivotTable and choose Ungroup (or Group… to set a desired level).
- For very large datasets, placing the PivotTable on a new worksheet can improve readability and performance.
Tips:
- Add a Slicer for the Date field (PivotTable Analyze > Insert Slicer) to change ranges interactively.
- Need a single max/min across the entire filtered range? After filtering, sort the Values column or add a second Values field and switch it to Max/Min.
- Pair with a PivotChart for a visual summary that updates with your filters.
This method avoids manual formula entry and allows dynamic interaction—great for presentations or multi-user scenarios. For highly customized outputs or batch automation across many sheets, consider the formula or VBA approaches.
Related articles:
- How to find position of first/last number in a text string in Excel?
- How to find first or last Friday of every month in Excel?
- How to vlookup find the first,2nd or nth match value in Excel?
- How to find value with highest frequency in a range in Excel?
Best Office Productivity Tools
Supercharge Your Excel Skills with Kutools for Excel, and Experience Efficiency Like Never Before. Kutools for Excel Offers Over 300 Advanced Features to Boost Productivity and Save Time. Click Here to Get The Feature You Need The Most...
Office Tab Brings Tabbed interface to Office, and Make Your Work Much Easier
- Enable tabbed editing and reading in Word, Excel, PowerPoint, Publisher, Access, Visio and Project.
- Open and create multiple documents in new tabs of the same window, rather than in new windows.
- Increases your productivity by 50%, and reduces hundreds of mouse clicks for you every day!
All Kutools add-ins. One installer
Kutools for Office suite bundles add-ins for Excel, Word, Outlook & PowerPoint plus Office Tab Pro, which is ideal for teams working across Office apps.
- All-in-one suite — Excel, Word, Outlook & PowerPoint add-ins + Office Tab Pro
- One installer, one license — set up in minutes (MSI-ready)
- Works better together — streamlined productivity across Office apps
- 30-day full-featured trial — no registration, no credit card
- Best value — save vs buying individual add-in