How to find unique/duplicate values between two columns in excel?
In daily Excel tasks, it's common to compare two lists of data—such as student name columns of different lengths—to identify which values appear in both lists (duplicates) or only in one (unique). Doing this manually can be error-prone and time-consuming, especially with large datasets. This article introduces multiple efficient methods to quickly compare two columns and find or highlight unique and duplicate values in Excel.
➤ Find Unique or Duplicate Values Between Two Columns with Formula
➤ Find Unique or Duplicate Values with Kutools for Excel
➤ Find and Count Unique or Duplicate Values Using Kutools Formula
➤ Highlight or Extract Unique/Duplicate Values with VBA
➤ Visually Highlight Unique or Duplicate Values with Conditional Formatting
Find unique/duplicate values between two columns with formula
When you wish to quickly identify values that are unique to one column or spot duplicates across two columns, utilizing Excel formulas can be both efficient and flexible. This approach is especially useful when you want a dynamic solution that updates automatically as your data changes.
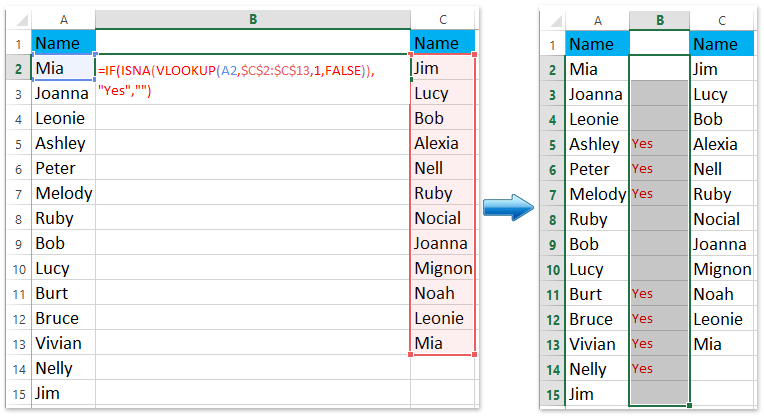
For example, to determine which values in Column A are not present in Column C (that is, unique to Column A), you can use the VLOOKUP and ISNA functions as follows:
In cell B2, enter this formula:
=IF(ISNA(VLOOKUP(A2,$C$2:$C$13,1,FALSE)),"Yes","")After entering the formula, drag the AutoFill Handle from B2 down to B15 to apply it to the entire range adjacent to Column A data.
If the formula returns "Yes" in Column B, the corresponding value in Column A does not appear in Column C—indicating it is unique to Column A. If the cell is blank, it means the value exists in both columns. This method is direct and works seamlessly for lists with or without duplicate entries.
Notes:
- In the formula, A2 refers to the value in Column A you want to check, and $C$2:$C$13 specifies the range you want to compare with in Column C. Adjust these ranges as needed based on your actual data.
- If you want to find values unique to Column C (that is, values that appear in Column C but not in Column A), enter the following formula in a blank cell next to Column C, such as D2, and drag it down:
=IF(ISNA(VLOOKUP(C2,$A$2:$A$15,1,FALSE)),"Yes","") - Ensure your ranges include all relevant data, and use absolute references (with $ signs) for the comparison ranges if you plan to copy the formula down multiple rows.
Practical tips: If your data set is large, using this formula-based approach enables automatic updating when your columns change, making it an ideal choice for dynamic lists.
Common issues: If your data contains extra spaces or case differences, results may not be as expected. In such cases, consider cleaning the data with the TRIM or UPPER/LOWER functions.
Find unique/duplicate values between two columns with Kutools for Excel
If you seek an even more efficient way to compare two columns and instantly select, count, or highlight unique or duplicate values, Kutools for Excel provides a practical Select Same & Different Cells feature. This utility is ideal for users who desire a user-friendly interface without setting up formulas or complex rules. It is especially effective when handling frequent comparison tasks, as it allows for instant visual identification and selection of unique or duplicate cell values.
1. Click Kutools > Select > Select Same & Different Cells.

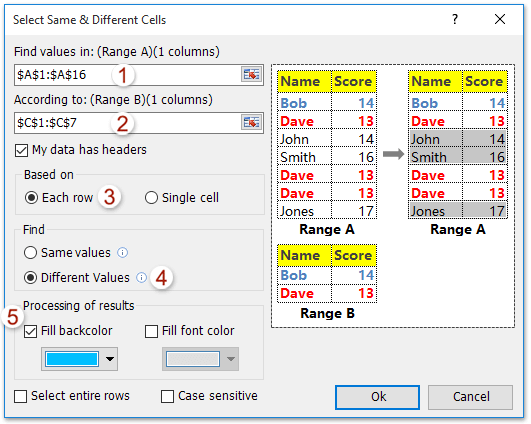
2. In the Select Same & Different Cells dialog box, follow these steps:
- (1) Specify the first column's values you want to check in the Find Values in box;
- (2) Set the comparison column in the According to box;
- (3) Under Based on, select the Each row option;
- (4) Within Find, choose Different Values to locate unique items;
- (5) Optionally, enable Fill backcolor and select a highlight color for the results;
- (6) Click OK to perform the comparison.
Note: (1) If your columns have headers, check the My data has headers option. (2) To find duplicate values, simply select Same Values in the comparison dialog.
Kutools for Excel - Supercharge Excel with over 300 essential tools. Enjoy permanently free AI features! Get It Now
3. All unique (or duplicate) values in the selected column will be instantly highlighted and selected, with a dialog box showing the count of matched cells.

If you need to find values unique to Column C (but not in Column A), simply switch the range assignments for "Range A" and "Range B" and repeat the above process.
This solution is recommended for users who prefer an intuitive comparison tool and need to handle varying data set sizes without writing or copying formulas.
Tip: Using backcolor highlighting can help you visually identify key data differences at a glance, which is valuable when presenting or reviewing results.
Find and count unique/duplicate values between two columns with formula of Kutools for Excel
For users who want to not only find but also count the occurrences of values from one column in another column, Kutools for Excel offers the Count times a word appears formula via the Formula Helper. This option is suited for scenario where knowing the frequency of each value is important, such as matching IDs, product lists, or attendance records.
1. Select a blank cell adjacent to the first column, such as B2. Then, click Kutools > Formula Helper > Count times a word appears.

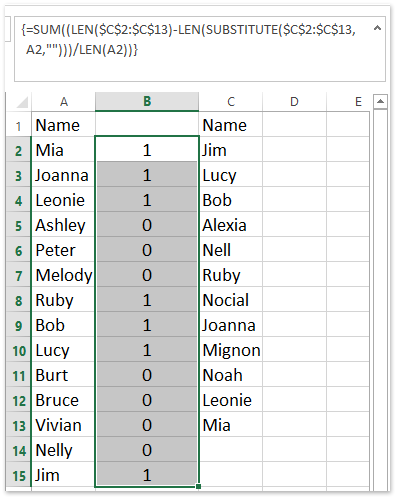
2. In the Formula Helper dialog, input the absolute range of the comparison column (for example, $C$2:$C$13) in the Text box and select the cell from the first column (such as A2) in the Word box. Click OK.


3. Use the fill handle to drag the formula result to the rest of the cells in Column B. Now, you will see how many times each value from Column A appears in Column C.
A result of0 means the value is unique to Column A, while a result of1 or more indicates the value exists in both columns, and the number specifies occurrence.
Kutools for Excel - Supercharge Excel with over 300 essential tools. Enjoy permanently free AI features! Get It Now
Operational tips: Make sure to use absolute addresses for range references so the formula is correctly filled down the column while checking each corresponding row item.
Scenario advice: This method is ideal for cross-verifying member lists, product SKUs, or any case where frequency analysis is needed in two data sources.
Error reminder: If the ranges do not match the actual data, or if there is inconsistency in data types (numbers as text, etc.), be sure to standardize your lists before using the formula.
Demo: find unique/duplicate values between two columns in excel
Highlight or Extract Unique/Duplicate Values Between Two Columns with VBA
For those who often need automated and repeatable processes, using VBA (Visual Basic for Applications) can provide a hands-free solution to highlight or extract unique or duplicate values between two columns. With a VBA script, you can instantly process columns of varying lengths and automatically flag, color, or even list these values elsewhere—greatly improving efficiency for large or frequently updated datasets.
This approach is especially suitable for users comfortable with Macros and who want to minimize manual steps or apply the solution across multiple sheets or workbooks.
1. Open your Excel file. Then, on the Excel ribbon, go to Developer > Visual Basic to open the VBA editor. In the editor, click Insert > Module, and paste the following code into the module window:
Example: Highlight duplicate values between two selected columns.
Sub HighlightDuplicatesBetweenColumns()
    Dim rngA As Range, rngB As Range
    Dim cell As Range
    Dim ws As Worksheet
    Dim xTitleId As String
    xTitleId = "KutoolsforExcel"

    Set ws = ActiveSheet

    ' Ask user to select the first range
    Set rngA = Application.InputBox("Select the first range (e.g., Column A):", xTitleId, , , , , , 8)
    If rngA Is Nothing Then Exit Sub

    ' Ask user to select the second range
    Set rngB = Application.InputBox("Select the second range (e.g., Column C):", xTitleId, , , , , , 8)
    If rngB Is Nothing Then Exit Sub

    ' Highlight duplicates in both ranges
    For Each cell In rngA
        If cell.Value <> "" And WorksheetFunction.CountIf(rngB, cell.Value) > 0 Then
            cell.Interior.Color = RGB(255, 255, 0) ' Yellow
        End If
    Next cell

    For Each cell In rngB
        If cell.Value <> "" And WorksheetFunction.CountIf(rngA, cell.Value) > 0 Then
            cell.Interior.Color = RGB(255, 255, 0) ' Yellow
        End If
    Next cell

    MsgBox "Duplicate values have been highlighted in yellow.", vbInformation, xTitleId
End Sub2. After pasting the code, close the editor. Return to Excel, press Alt + F8, select HighlightDuplicatesBetweenColumns from the macro list, and click Run. When prompted, select your two target ranges.
💡 To highlight unique values instead: Modify the comparison condition from > 0 to = 0 in both If statements and optionally choose a different color (e.g., green).
Tips: Always backup your worksheet before running a macro, as cell formatting changes are not undoable using Ctrl+Z. You can also adjust the color codes (e.g., RGB(255,255,0)) to suit your preferences.
Troubleshooting: If you receive an error, make sure:
- The Developer tab is enabled in your Excel.
- Your macro security settings allow macro execution.
- The selected ranges are valid and contain comparable values.
Pros: Fully automated, works across different file sizes.
Cons: Requires macro permission and basic VBA familiarity.
Visually highlight unique or duplicate values between two columns with Conditional Formatting
Conditional Formatting provides an intuitive and dynamic way to highlight values that are duplicated or unique across two columns. It’s ideal for quick comparisons and does not require adding extra columns or VBA code. All formatting is updated in real-time when your source data changes.
Highlight duplicates between two columns:
- Select the range in the first column you want to format (e.g., A2:A15).
- Go to Home > Conditional Formatting > New Rule.
- Select Use a formula to determine which cells to format.
- Enter the following formula:
=COUNTIF($C$2:$C$13, A2)>0 - Click Format, choose a highlight color (e.g., yellow), and click OK.
This highlights cells in Column A that also appear in Column C.
Highlight unique values in one column:
- Select the same range (e.g., A2:A15).
- Repeat the steps above to create a new rule.
- Enter the formula:
=COUNTIF($C$2:$C$13, A2)=0 - Choose a different color to distinguish unique values.
Apply the same logic to Column C if needed by reversing the formula references (e.g., highlight C2:C13 based on A2:A15).
✔ Advantages: Instant visual feedback; no need for helper columns; dynamically updates with data changes.
⚠ Precautions: Too many formatting rules on large datasets may slow performance. Always double-check range references, especially when columns are not adjacent.
Best Office Productivity Tools
Supercharge Your Excel Skills with Kutools for Excel, and Experience Efficiency Like Never Before. Kutools for Excel Offers Over 300 Advanced Features to Boost Productivity and Save Time. Click Here to Get The Feature You Need The Most...
Office Tab Brings Tabbed interface to Office, and Make Your Work Much Easier
- Enable tabbed editing and reading in Word, Excel, PowerPoint, Publisher, Access, Visio and Project.
- Open and create multiple documents in new tabs of the same window, rather than in new windows.
- Increases your productivity by 50%, and reduces hundreds of mouse clicks for you every day!
All Kutools add-ins. One installer
Kutools for Office suite bundles add-ins for Excel, Word, Outlook & PowerPoint plus Office Tab Pro, which is ideal for teams working across Office apps.
- All-in-one suite — Excel, Word, Outlook & PowerPoint add-ins + Office Tab Pro
- One installer, one license — set up in minutes (MSI-ready)
- Works better together — streamlined productivity across Office apps
- 30-day full-featured trial — no registration, no credit card
- Best value — save vs buying individual add-in